Open MTA Data
Exploring GTFS feeds published by the Metropolitan Transportation Authority (MTA)
this article was originally published on my Substack here
We're going to do some exploratory data analysis of the General Transit Feed Specification (GTFS). It's an open source data specification originally pioneered by TriMet and Google for use in Google Maps. Since then it has expanded to multiple public transit authorities around the world and is used by many public and private resources.
Almost 20 years later many public transport authorities release their GTFS data to be accessible by the public. While most of the public interacts with it through transportation applications like Google and Apple Maps, few interact with the data directly. With a lower-level access comes the opportunity for greater and more personal insights. In this article, I will be doing a simple exploration of the MTA's subway GTFS data.
data pulled here: https://www.mta.info/developers
If this is your first time on this blog, welcome! I'm a software engineer working in distributed systems and finance. In my free time, I try to explore and process the world using code. Thanks for reading!
Entities
MTA's GTFS is aimed towards being both machine and human readable, so it's delivered as a series of CSVs with the following entities:
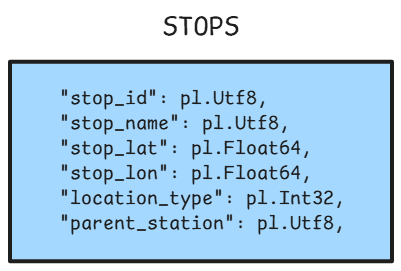
Stops corresponds to physical location that a train stops with a single stop being split by direction:
stop_id,stop_name,stop_lat,stop_lon,location_type,parent_station
A27,42 St-Port Authority Bus Terminal,40.757308,-73.989735,1,
A27N,42 St-Port Authority Bus Terminal,40.757308,-73.989735,,A27
A27S,42 St-Port Authority Bus Terminal,40.757308,-73.989735,,A27
Where A27N and A27S are the northbound and southbound sides of the station servicing A, C and E.
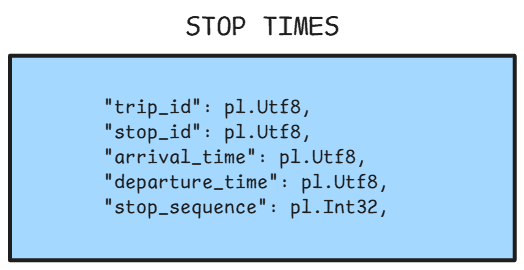
Stop times contains the data that we intuitively associate with trains and their routes. For a particular train, this table describes all of its stops, arrival time, departure time and stop_sequence. The stop_sequence is implied by the arrival and departure times, but I imagine it was included for convenience.
trip_id,stop_id,arrival_time,departure_time,stop_sequence
AFA24GEN-1038-Sunday-00_000600_1..S03R,101S,00:06:00,00:06:00,1
AFA24GEN-1038-Sunday-00_000600_1..S03R,103S,00:07:30,00:07:30,2
AFA24GEN-1038-Sunday-00_000600_1..S03R,104S,00:09:00,00:09:00,3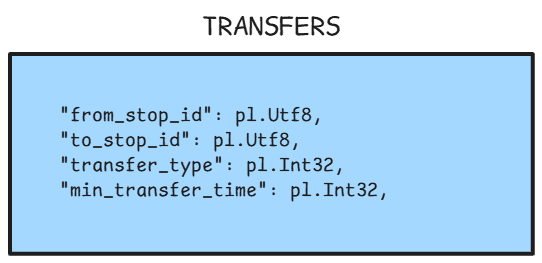
Transfers describes whether one can transfer in between parent stations and how much time it will take
from_stop_id,to_stop_id,transfer_type,min_transfer_time
101,101,2,180
103,103,2,180
104,104,2,180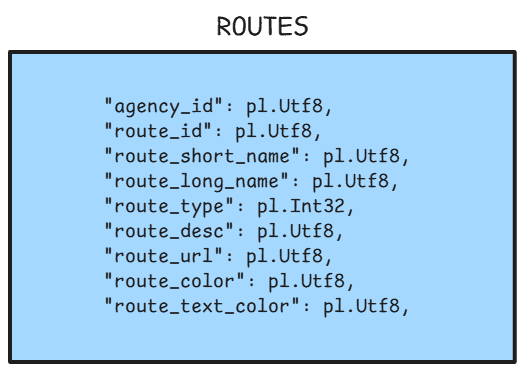
Routes are essentially the train line, 7, 4, 5, F express, G … etc
route_id,route_short_name,route_long_name
1,1,Broadway - 7 Avenue Local
2,2,7 Avenue Express
5,5,Lexington Avenue Express
7,7,Flushing Local
7X,7X,Flushing Express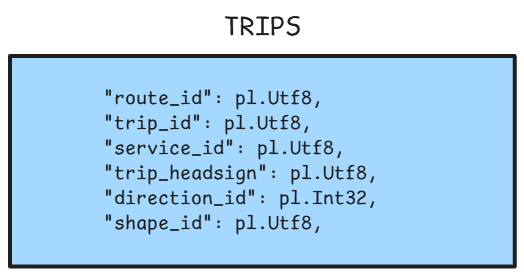
Trips describe the individual train running on the track
route_id,trip_id,service_id,trip_headsign,direction_id,shape_id
1,AFA24GEN-1038-Sunday-00_000600_1..S03R,Sunday,South Ferry,1,1..S03R
1,AFA24GEN-1038-Sunday-00_002600_1..S03R,Sunday,South Ferry,1,1..S03R
1,AFA24GEN-1038-Sunday-00_004600_1..S03R,Sunday,South Ferry,1,1..S03R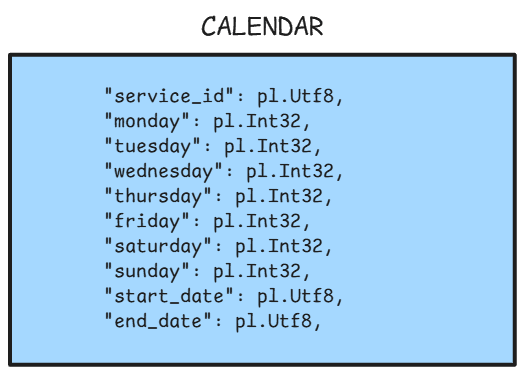
The calendar describes the days of the week that a particular trip associated with the service_id actually runs. In particular, services are described by days of the week not the literal date itself. This makes the dataset much smaller, but as we'll find out in later posts that it will complicate the idea of which train is coming "next". We know that Monday is after Sunday, but representing that programmatically is a bit more complicated than saying that 2/17/25 is after 2/16/25.
service_id,monday,tuesday,wednesday,thursday,friday,saturday,sunday,start_date,end_date
Sunday,0,0,0,0,0,0,1,20250118,20250518
Saturday,0,0,0,0,0,1,0,20250118,20250518
Weekday,1,1,1,1,1,0,0,20250118,20250518
Weekday-1,1,1,1,1,1,0,0,20250118,20250214
Weekday-2,1,1,1,1,1,0,0,20250218,20250518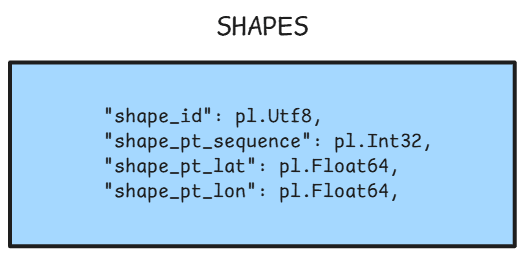
Shapes describes the outline of a route on a map using longitude and latittude.
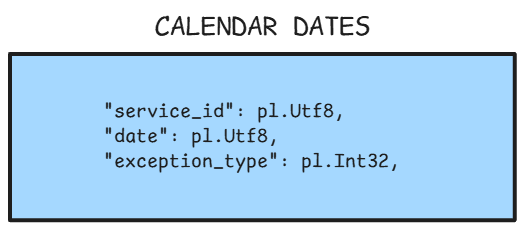
Exceptions to particular services by dates
service_id,date,exception_type
Saturday,20250217,1
Weekday,20250217,2
In this date we can see that we're running the Saturday service on Monday 2/17/25 since it's a President's day which is a national holiday in the United States of America.
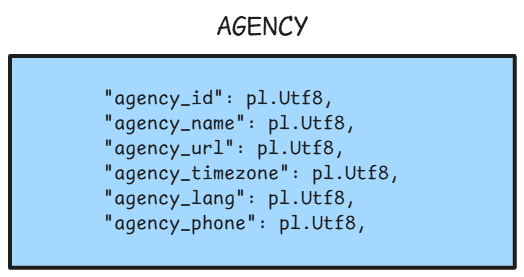
Represents the agency associated with the all the above transportation data. When the GTFS data contains multiple agencies, this would let you to associate different routes with different fare information. Since everything in NYC is 2.75 these days there's no need to use this here.
Simple Questions … Simple Answers
With the data as is, let's ask some simple questions
How many trips depart every hour?
The naive way to answer this question is to just parse the hour component of the string departure time in the stop times table. It comes in the form hh:mm:ss. A naive parsing produces the following chart:
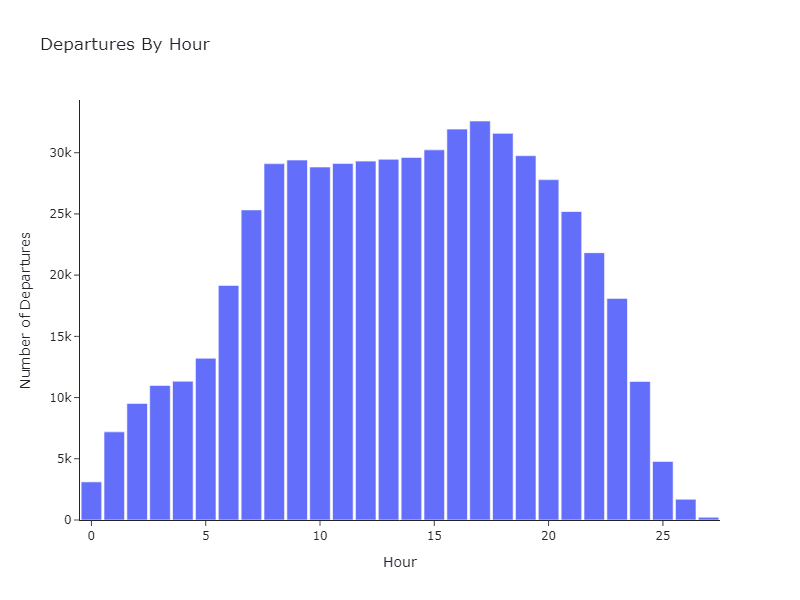
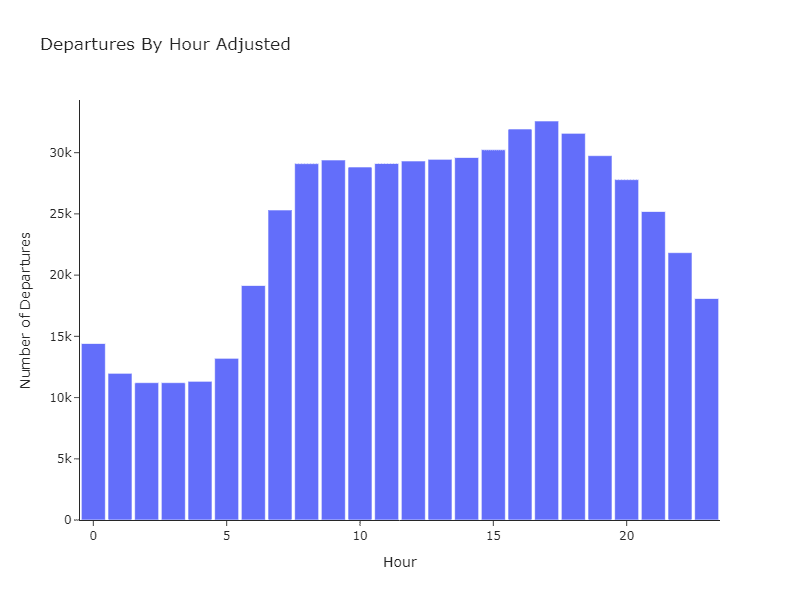
We can see that some hour values are out of the expected 0-23 hr bounds. For example, we could have a departure time of Monday 25:00:00 when Tuesday 01:00:00 would suffice. That's something we will have to handle once we start to create routes in this map. The adjusted graph shows a much more obvious difference between working hours and non-working hours.
Which routes have the most trips on weekdays?
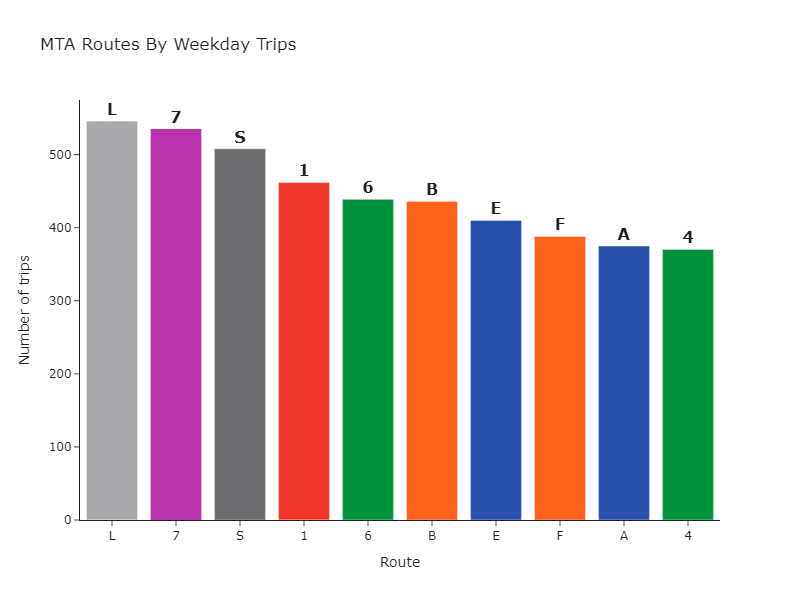
This diagram describes the number of Monday-Friday trips where a trip is a single train traveling from the first stop to the last top on a route. Each direction along a route is a separate trip.
As we can see there's a lot of love for Manhattan bound routes on the weekday. NYC residents looking to commute between Brooklyn and Queens tend to go through Manhattan for this very reason. If you are a commuter to the office, trip frequency can really affect your ability to be on time to work. Let's try to quantify that.
Upper East vs Upper West
The upper east and upper west side of Manhattan have their unique and loveable qualities. I know fellow residents who will argue ad nauseum about which side has the best apartments, where the best food is and even who has the best river runs (it's the west side). For the sake of creating a problem we can solve, let's imagine you're commuting to time square 42nd street from 7:00-8:45a.m. on weekdays. You want to be at most 10 minutes from work, so you're choosing between living at 103rd street on the west side and 86th street on the east side. Your routes are the 1 and the Q respectively.
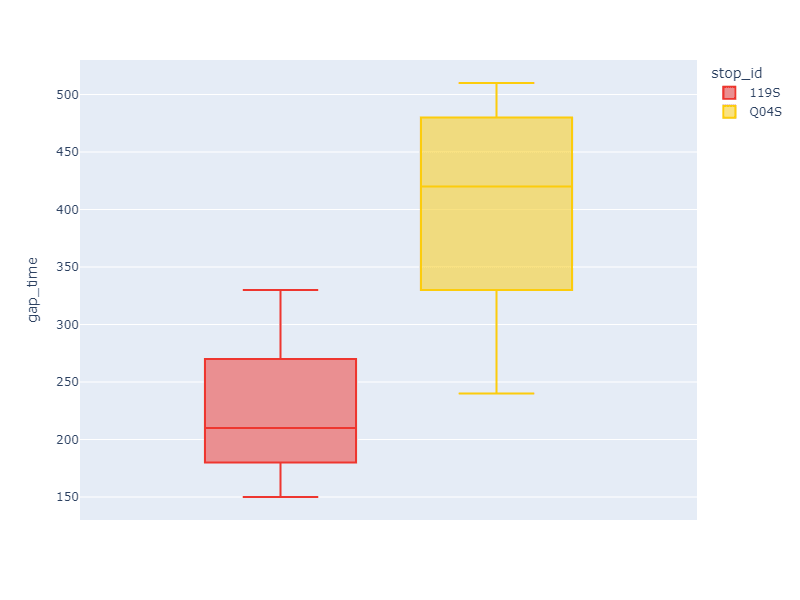
With the 1 train on the left and the Q train on the right, we can see there are small differences in your commute. The median wait time for the 1 train is about 3.5 minutes while the time on the right is 7 minutes. If you are commuting to work on the Q and miss your train, half the time that will add at least 7 minutes to your commute. Where there is a difference, there is an opportunity for optimization!
Conclusion
The next part of the series will involve me turning this raw GTFS data into a routable data structure. We will cover the process, the pitfalls and some basic navigation methods. Stay tuned!